A few months ago, Microsoft introduced a new functionality in the Sentinel Analytics Rules which can be used to dynamically define values in incidents. Instead of hardcoding values like the name of the incident or its description, one can specify the content based on the KQL-query used for alerting. This is an option I needed in a lot of other SIEMs in the past, but most of the time it was not there. Here, in Sentinel, I can finally use parameterized alerting instead of painful workarounds.

Options offered by Sentinel
The option to use parameters in various fields can be accessed in the Analytics Rule wizard on the “Set Rule Logic Tab”. The function can be found by navigating to the Alert Enrichment / Alert details part of the page.
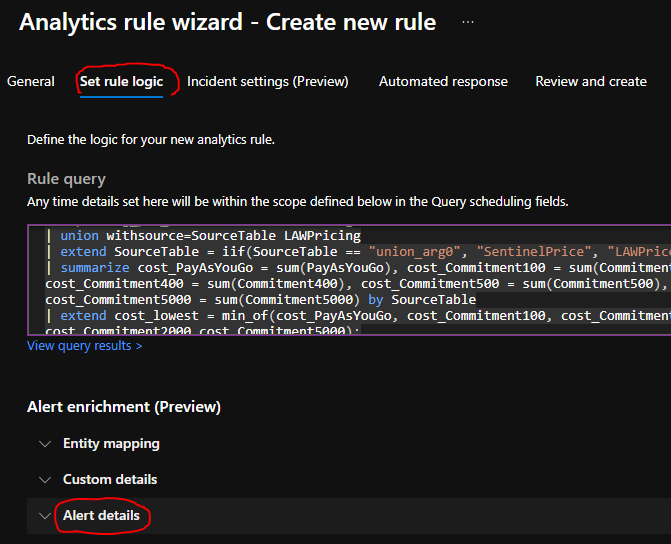
Right now, the fields in which we can use parameters to define their values are pretty limited. For example, there is no option to execute Playbooks defined by the query itself by using these parameters. Or you can’t add tags to incidents based on the output of the KQL query with this function, even though it would be a handy addition. But the potentially most used and most needed fields are there for us.
As of now, 4 different fields can be parameterized:
- Alert Name
- Alert Description
- Tactic
- Severity
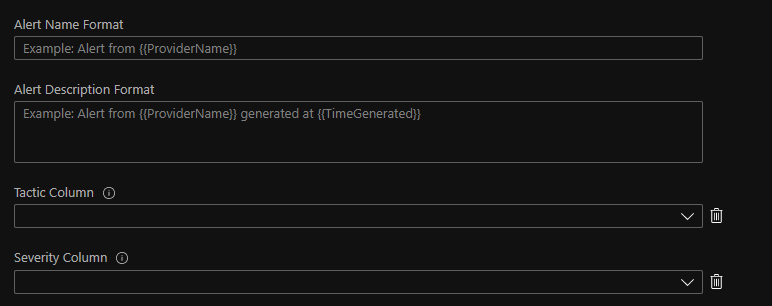
The Alert Name and the Severity field is something potentially really beneficial for everybody. Later on, I’m going to show some examples to explain why these fields with this new function are really convenient for us now.
Being able to define the Tactic field is also good. But Microsoft does not use the exact same Tactics as MITRE does. Instead of Reconnaissance and Resource Development Microsoft utilizes the PreAttack Tactic (which Tactic is non-existent in the MITRE Enterprise Att&ck matrix). This means you have to modify the Tactic value to ensure Sentinel can process it properly. Also, Techniques are not supported at all, so most of the time I rather define these fields in a different way (see in my previous blog post: Using Att&ck framework in Azure Sentinel ).
The last field you can dynamically define is the Alert Description field. I think parameterizing this field is mostly just a cosmetical thing. You can put some useful information based on the KQL query into the description field, but since this field is limited at this point and on the Azure Portal it is shown in a small textbox, longer, more detailed information is not worth showing here. Thus, I consider it less useful.
How to use parameters
The how-to part is simple and straightforward.
In case of Alert Name and Alert Description definition you can define any plain text and then add one or more projected fields from the KQL query as a parameter, by putting the field name between the “{{“ and “}}” characters. For example: Exploit {{exploit_name}} used against a system. In this example, the “exploit_name” is a projected field that is going to be replaced by an exploit when the rule triggers.

So, the alert (a test one) will look like this:

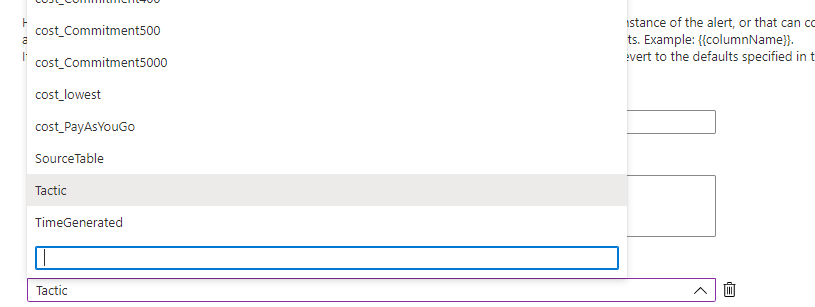
In case of Severity and Tactic fields you can pick one of the projected fields from a drop-down menu (this one looks better with a light theme).
I also tested what happens if I use 3 or 4 ‘{‘ characters instead of just 2. If you do this, the additional ‘{‘ characters are going to be processed as plain text. Thus, you can’t nest fields this way. This is not a big issue though, as this is not a frequently needed function. The test was just for fun. So using the {{{{exploit_id}}}} will be shown in the Alert Name after triggering as {{CVE-2222-35427}}, so the additional ‘{‘ characters are kept there as plain text.
Benefits of parameterized fields
Here are some examples where this new functionality can be useful and where I could have used it in the past. Also, I am going to explain the pains I had in the past due to the lack of this option in other SIEMs and my workarounds through these examples.
Processing alerts from third-party tools
It is a common need in a SIEM to create alerts/incidents when a third-party tool detects something and forwards this information to the SIEM. These detections are often forwarded from the third-party tool to a SIEM where a logic is created to pick up these events and create a SIEM-native alert/incident out of them. However, most of the time, it is not trivial or easy to do this efficiently.
Let’s imagine we have a third-party EDR solution that could detect various scenarios. It can detect actions like a malicious file is detected, or there is some tinkering with the memory on a host, or when a suspicious process execution happens. These are three really different alerts and they need different actions to be taken when they happen. In an event like this – coming from the EDR – we can find various pieces of information, like the name of the alert, maybe some description, severity values, etc, etc. But most of the time these values can’t be used to dynamically create SIEM alerts due to the lack of capabilities in the SIEM.
In the past, I had the luck to process similar events and we usually handled them in two different ways.
First, we handled them based on their Severity. In this case, only a small number of rules are needed. One for each severity. The pseudo-code of a rule can be something like this:
LogSource == EDR and Severity == Low
Or
LogSource == EDR and Severity == Medium
The problem here is that now, at the time of automation, this kind of separation is not sufficient. You possibly want different automation to be executed in case of different alerts but regardless of the Severity. Also, this can be problematic from a reporting point of view. Seeing a lot of FPs for an alert called “EDR - Medium alert” is not helpful, you actually have to see which type of alerts are prone to FP.
The other solution I implemented in the past was to cover each possible EDR event by an individual SIEM rule. This way we could fine-tune, whitelist and automate each alert individually and effectively. However, the management was a pain in the neck. Most of the vendors do not disclose all of their detections and even when they do, they can add new ones anytime.
So, the way EDR alerts were handled in the second case is that we had 3 types of rules. The first type of rules were the individual rules for each EDR alert. This type made up for 99% of the rules. The second type was a collector rule to cover everything we did not want to alert on individually. Most of the time these were Informational alerts that were not investigated at all, but we still wanted to have them. And the last type of rule was also a collector rule to create an alert for us when a new, yet unknown and uncovered EDR alert appeared. So, we could investigate that alert and create an individual rule and discuss it with the SOC team. This method needed continuous management from our side, so it wasn’t too effective for us.
Solution
This case can be solved by parameterized fields and alerts. As I have mentioned already, EDR alerts (events) typically contain the name of the alert, a short description, and additional information. Instead of handling all EDR alerts by an individual SIEM rule, we can create one parameterized alert in Sentinel easily.
One simply has to define the alert name to look something like this:
EDR alert: {{edr_alert_name}}

In which case the ‘edr_alert_name’ is a value stored in the event and projected by the KQL query.
EDR
| project TimeGenerated, Description, edr_alert_name
Additionally, with this method, you can cover alerts with various Severity and Tactic values just by one Analytics Rule, instead of using multiple rules with static Severity and Tactic values assigned to them.
Runtime Severity Calculation
The severity of an alert is frequently not something you can define at the time of the rule creation. A lot of variables can take place in a rule and its execution which makes it impossible to pre-define the severity of the rule. One solution is to create multiple rules for various severities. This is a working solution, but it is hard to manage and most of the time it is simply superfluous. Also, with hardcoded values, you cannot dynamically define the severity based on various information (or you will have an infinite amount of individual alerts).
A typical scenario for this is when somebody creates an alert but wants the alert to create a Critical severity ticket if the affected systems are Crown Jewel systems, High Severity if they are Servers, and Medium if they are workstations or other less important hosts. You can create 3 different rules here, but then, in case of any changes in the rule logic, you have to modify three rules, instead of just one.
Simple solution for this with inline data. This does not need too much explanation after the previous example:
let crown_jewel=dynamic(["cj1","cj2"]);
let servers = dynamic(['server1','server2']);
let systems_input = datatable (system:string)
   ['ws1','ws2','cj2','ws3','server1'];
systems_input
| extend severity = case(system in~ (crown_jewel), "Critical",
                        system in~ (servers), "High",
                        "Medium")
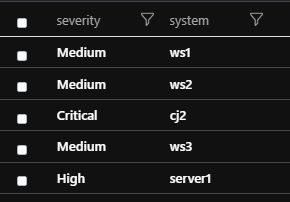
At the end you can use the severity field as a parameter to dynamically define the severity of your Incident in Sentinel.
More articulate alert naming (and descriptions)
Alerts coming from some tools do not have a clear and conscious name. Seeing 10 Exploit attempts against the server is not necessarily helpful, especially without any context. This is especially true when we are talking about a chatty tool. Adding more and more data to the name of the alert (or description) can help the analyst quickly decide which alert to pick up, to see the connection between alerts, and to see the overall picture.
Let’s see an example again. The first example shows how 5 alerts in a row without context does not help too much. Here are the names of the 5 alerts:
- Exploit attempt against server
- Exploit attempt against server
- Exploit attempt against server
- Exploit attempt against server
- Exploit attempt against server
This is literally not useful without other information. Adding some extra clues can help though:
- CVE-123 Exploit attempt against server X
- CVE-223 Exploit attempt against server X
- CVE-444 Exploit attempt against server X
- CVE-445 Exploit attempt against server X
- CVE-001 Exploit attempt against server X
Previously we did not know that the exploits were against the same server (X) and that they were different exploits. With this additional information, an analyst can conclude that somebody tries to attack a given server by testing multiple CVEs against it. The analyst already has an overview, it is clear the attempts are related, they potentially should be handled in 1 ticket at the end. But with more information:
- Unsuccessful CVE-123 Exploit attempt against server X
- Unsuccessful CVE-223 Exploit attempt against server X
- Unsuccessful CVE-444 Exploit attempt against server X
- Unsuccessful CVE-445 Exploit attempt against server X
- Successful CVE-001 Exploit attempt against server X
With this additional information the analyst can also assume it is a higher severity alert because, at the end, there is a success. There is a chance the attacker was successful, so the ticket should be handled with higher priority.
So, using a dynamic/parameterized alert naming (or description creation) can be useful for the analysts. Just by using the following pseudo-definition, we can utilize the parameterized alert naming from the example (the exact values depend on your field names and KQL query):
Alert name:
{Status} {CVE_ID} Exploit attempt against {host_type} {hostname}
Pitfalls
The previous examples were just the tip of the iceberg. You can modernize your alerting in several ways with dynamic/parameterized alerting. However, there are some drawbacks you must be aware of if you want to utilize this solution.
Reporting problems due to incident/alert naming
In an Incident event in Sentinel you can find two values that can help you identify the underlying rule. One of them is the ‘RelatedAnalyticRuleIds’, but this field only contains IDs and not names. So, this field is harder to process by a human (you can still correlate it with other logs to translate the id to a name). The other field in an Incident event is Title. The Title contains the parameterized alert names in a filled-out form. So, if you defined a parameterized alert name in the rule like this: Malicious URL opening: {{url}} then in the logs you will see this: Malicious URL opening: forensixchange.com. Thus, the Title is different for each URL.

However, when you are curious how noisy a rule is, or how many False Positives were created by a rule you are not interested in the individual values (URLs in this case). You are only interested in the rule itself. Because the Title is different for every value, so you won’t be able to correlate the Incident events to count them by Title. This will potentially need you to change your existing code if you used Title in the past.
One example of this can be found in the Microsoft provided Security Operations Efficiency workbook. In this workbook the “Incidents created by name” diagram is created by using the Title the following way:
| summarize count() by bin(CreatedTime, 1h), Title

One can see that my 1 “Randomtexttest” rule created 4 different entries, simply because the rule triggered with 4 different values as parameters. I would like to see how noisy my rule is and not how noisy a specific parameter is.
This is not necessarily incorrect, but you have to be aware in case of parameterized fields this query will not count the incidents created by the same alert, it will only count the incidents with the same name. And the two values are not the same.
In case of alerts, we are luckier because every SecurityAlert event contains two fields we can use properly. The AlertName field contains the parameterized and replaced name like: “Malicious URL opening: forensixchange.com”. At the same time, the event also has a field called ExtendedProperties/ Analytic Rule Name. This field contains a static name, the same name we can see when we open the Analytics page in Sentinel. This is the static name of the Analytics Rule itself and not the name of the created alert.

(parsing of Analytic_Rule_Name_ = tostring(parse_json(ExtendedProperties).[“Analytic Rule Name”]) )
But even in this case, there can be issues. You can’t use these fields every time. The AlertName is better in some scenarios while the “Analytic Rule Name” is a better fit for others. For example, the AlertName - since its dynamic – can be a good fit in case of the scenario we discussed in the “Processing alerts from third party tools” section. Here, we actually want to see the number of the different alerts, so the parameters are important. On the other hand, the “Analytic Rule Name” is better in case of Malicious URL opening: {{url}} type of alert if we want to find FP-heavy rules.
A lot of third-party queries and workbooks are not parameterized-alert-aware, so if you want to use something from the internet, there is a chance you have to modify it a little bit.
Executing Playbooks
When you want to execute a Playbook for an incident you can create an Automation Rule and then define the “Analytic Rule Name” for which you want the Automation Rule to trigger. However, you can only choose the value from a drop-down list, and the list will only contain the static name of the Analytic Rule, but not the various Alert Names.
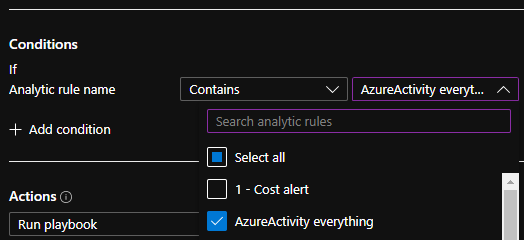
So, if you have an EDR that forwards different alerts, and you want to execute different Playbooks for the different alerts, and you decided to use parameterized alerting then you will only have 1 Analytic Rule, so you won’t be able to define different Playbooks for the EDR alerts.
Luckily, the solution is simple here. Even though the “Analytic Rule Name” field only contains the static rule name, you can use the Title field to filter it further. And the Title field – as we have seen before – contains the dynamic name.
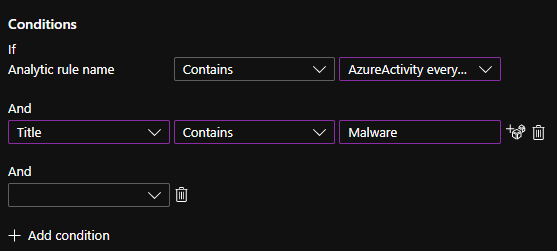
So, you can create a collector Analytic Rule to catch every alert from the EDR. You can call it the EDR Rule. Then, in the Automation rule, you can use the condition Analytic rule name Contains EDR Rule. And in the second condition, you can define the specific alert for which you want to execute the Playbook. For example, one Playbook for every Exploit attempt.
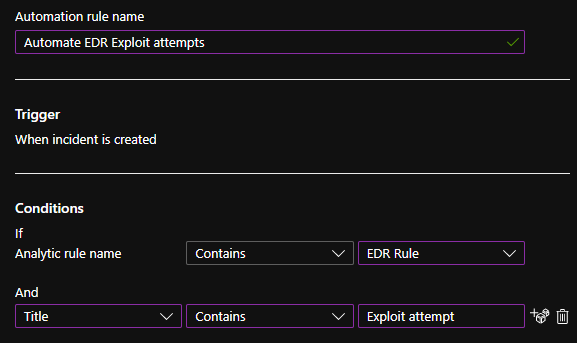
The nastiest thing here is that the Automation Rules has to be changed manually in order for this solution to work.
More Complex rules and rule-tuning
This is only the case if you want to handle multiple different alerts with one common rule, just like I mentioned in the “Processing alerts from third party tools” section. Covering multiple use cases with only one rule can make your life hell at some point.
Let’s say you have two different external alerts you want to cover with one rule. One of them is an exploit attempt while the other one is a malware execution. It is obvious that the information in the two alerts is heavily different. The former one can have a ‘CVE number’ field that won’t be there in the other, and the latter one can have a ‘Malware actor’ field that won’t appear in the former one. When you do the parsing, projection, or entity definition in your rule you must process all possible fields. This can result in a lot of empty or default-value fields at the end and a really long and not clear rule. The more different alerts you want to cover with one rule the messier it gets.
Also, the white/blacklisting will be trickier. Maybe you want to whitelist (exclude) some machines from one rule, but not the other. You either forget these wishes of yours or you create complex whitelists in order to achieve your goal.
For example, the following whitelist won’t work because it removes the machines from every alert covered by your rule:
| where hostname != “testmachine”
To only cover one rule by your whitelist you have to define the specific alert as well:
| where not (hostname == “testmachine” and alert_name contains “Malware execution” )
And you have to do the same for each alert and their whitelists. Which – in case of too many alerts – will end in a long white/blacklist section in your code making it hard to read and maintain.
Summary
Parameterized alerts and field definition is definitely a fantastic feature that I have missed for a long time in various SIEM solutions. I’m glad it’s here. But it is really important to be aware of its implications on your existing processes, tools and alerting. Implementing it in a new environment can be less of a pain but starting to use it in your already established SOC can show you some nasty time. So, experiment with it mindfully.
