
As companies grow and adopt new IT solutions, they naturally generate more data—and with that comes rising data storage costs. This is where telemetry data management or telemetry data pipeline tools come into play. These tools can help by trimming down unnecessary data or moving less critical information to more affordable storage options, saving both space and money.
There is a wide range of free tools available that allow you to build a custom pipeline to suit your needs. In this post, I will walk you through how to use Fluent Bit to replicate some of the features found in professional pipeline tools and Sentinel. Let’s dive in and see how you can take control of your data!
 Featured image
This will be a two-part series where I’ll walk you through how to create aggregated logs for Sentinel - similar to what you’d achieve with Summary rules -, how to send this data to an affordable Storage Account, and how to replay it later for deeper investigations.
Articles:
- Aggregated Logging: In this first part, we’ll focus on using Fluent Bit Stream Processing to create aggregated logs. I’ll cover how Fluent Bit and Stream Processing work, their advantages and limitations.
- Data Replay: The second part will dive into efficiently processing and storing this data, ensuring it can be reintroduced into Sentinel when needed. (Read the second part)
Use Case Scenario to cover:
Imagine you want to leverage your Threat Intelligence (TI) dataset to monitor firewall logs for instances where someone connects to a malicious IP or when a malicious IP communicates with your systems. To achieve this, you don’t need to ingest all the firewall logs into your SIEM. Instead, it’s sufficient to work with a list of source and destination IP pairs, which can then be correlated with your TI dataset. This approach minimizes data ingestion while still enabling the coverage of this use case.
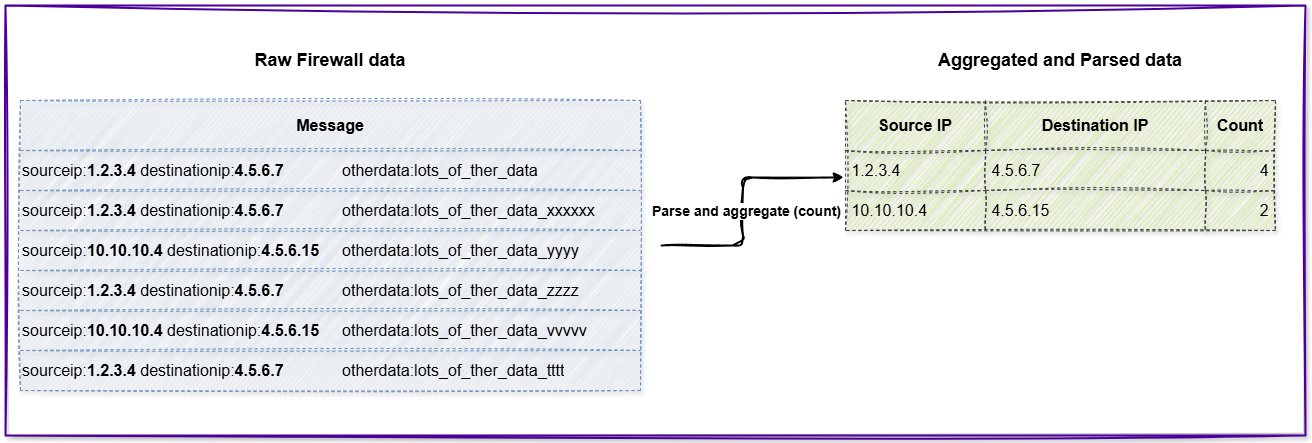 Aggregated logging (counting in this case) decreases the number and size of the events.
So, let’s start with the Stream Processing and log aggregation aspects.
Fluent Bit
For those unfamiliar with Fluent Bit, it’s a lightweight log processor and forwarder. Rather than covering the basics here, I recommend checking out the detailed guide that Microsoft published recently—it’s a great starting point.
Stream Processing – for aggregation
Fluent Bit’s Stream Processing feature enables querying continuous data streams while the data is still in motion, using its built-in SQL engine. It allows you to write SQL queries to process and aggregate data in memory. This approach treats incoming events not as isolated pieces of data but as part of a larger stream, enabling you to combine and transform them into new, meaningful events.
Example: Instead of storing every individual firewall event, Fluent Bit can perform real-time aggregation using its in-memory stream processing. For instance, it can automatically count how many events occur between specific source/destination IP pairs while the data is still in motion. This contrasts with Sentinel’s Summary rules, which analyze already-stored data.
But why would you use this option instead of going with Summary rules which have much more capabilities, and possibly you are more familiar with it already.
Fluent Bit vs. Sentinel Summary Rules
- Stored vs in-memory data: If you don’t plan to store data in Sentinel, Summary rules are not an option since they rely on data already stored in Sentinel tables. Fluent Bit, on the other hand, allows you to process data on-the-fly and decide where to store the raw logs—whether that’s a cheaper storage solution or another system entirely.
- Timeouts and reliability issues: In large environments, especially when dealing with unparsed data (looking at you, Syslog table), we’ve encountered timeout problems when running Summary rules (timeout after 10 minutes). Separately, there have also been cases where Summary rules simply failed to write results to the target table without any error messages.
- Event and data size limitations in Summary rules: There is a limitation in Summary rules where a single bin can contain a maximum of 500,000 events or up to 100MB of data. While these thresholds might seem generous, they are surprisingly easy to hit when processing millions of events over just a few hours. All these limitations are making reliable processing of large data volumes even harder.
Whenever Summary rules fail to generate output, there’s a risk of missing important detections. As your environment expands, you’ll find yourself running into these limitations more frequently.
Fluent Bit setup
To address our use case, we need to configure Fluent Bit with the following steps:
- Input Configuration: Set up an input plugin to collect the data you want to process.
- Data Parsing: Parse the incoming logs to extract source and destination IP addresses.
- Stream Processing: Use Fluent Bit’s Stream Processing feature to aggregate the data.
- Output Configuration: Push the processed data to Microsoft Sentinel for the defined use case.
A sample log we use (relevant from a parsing PoV):
<34>1 2025-04-02T13:18:09.003Z testfirewall.tokesi.cloud FW01 12345 ID12 - ‘sourceip:1.2.3.4 destinationip:3.4.5.6 sourceport:13455 destinationport:443 username:testuser action:allow categorization:newdomain otherdata:gibberishdata’
1. and 2. Input Configuration and Data Parsing
For this test, I’m sending sample data to UDP port 5555 and tagging the traffic accordingly. To extract the source and destination IP addresses, I’ve set up the following Fluent Bit configuration and parser. This setup ensures that the incoming logs are properly parsed and processed for further use.
[INPUT]
    Name               syslog
    Listen             0.0.0.0
    Port               5555
    Mode               udp
    Tag                syslog.5555
Parser custom_syslog [PARSER]
Name custom_syslog
Format regex
Regex ^\<(?<pri>[0-9]{1,5})\>1 (?<time>[^ ]+) (?<host>[^ ]+) (?<ident>[^ ]+) (?<pid>[-0-9]+) (?<msgid>[^ ]+) (?<extradata>(\[(.*)\]|-)) 'sourceip:(?<srcip>[^ ]+) destinationip:(?<dstip>[^ ]+) (?<message>.+)'$
Time_Key time
Time_Format %Y-%m-%dT%H:%M:%S.%L
Time_Keep On
Types pid:integer 3. Stream Processing
Fluent Bit’s Stream Processor uses SQL for real-time data aggregation. For our use case, this function generates the pairs of source and destination IP addresses and uses the count() aggregation to determine how many events are associated with each pair. In other words, it tallies the number of occurrences for every unique source-destination IP combination.
Here’s how my SQL query is structured.
[STREAM_TASK]
  Name fw_stream
  Exec CREATE STREAM fw_aggregated WITH (tag='fw_aggregated') AS SELECT srcip, dstip, NOW() AS process_time, COUNT(*) FROM TAG:'syslog.5555' WINDOW TUMBLING (900 SECOND) GROUP BY srcip, dstip;
Explanation to the code:
CREATE STREAM fw_aggregated - This creates a new stream to be used within the processing pipeline.
WITH (tag='fw_aggregated') - Fluent Bit uses tags to identify and route data. The fw_aggregated tag is assigned to this new stream for further processing.
AS SELECT srcip, dstip, NOW() AS process_time, COUNT(*) - The query extracts srcip and dstip to form IP pairs, applies COUNT(*) as the aggregation function, and adds a timestamp (NOW()) to track when the aggregation occurred for better visibility in the SIEM.
FROM TAG:'syslog.5555' - This specifies that the input data comes from records tagged as syslog.5555, which corresponds to the input configuration defined earlier.
WINDOW TUMBLING (900 SECOND) - The data is processed in non-overlapping 15-minute intervals (tumbling windows), ensuring clear segmentation of aggregated results.
GROUP BY srcip, dstip - Groups records by source and destination IPs, effectively creating one entry per IP pair within each time window.
For KQL folks you can describe this SQL query in KQL something like this:
firewall_data
| where tag == 'syslog.5555'
| summarize count() by srcip, dstip, bin(TimeGenerated,15min)
| extend process_time = now()
| extend tag = 'fw_aggregated'
4. Output config
For the sake of simplicity, I used the legacy API of Sentinel (Log Analytics workspace), but Fluent Bit also supports the new DCR-based tables.
Fluent-bit.conf:
[OUTPUT]
  Name azure
  Match fw_aggregated
  Customer_ID <workspace_id>
  Shared_Key   <workspace_key>
  Log_Type FWAggregated_CL
Final solution
By the end of this post, we have successfully set up a pipeline that collects specific firewall logs on port 5555, aggregates the data based on source and destination IPs, and sends only the aggregated data to Microsoft Sentinel for detection purposes.
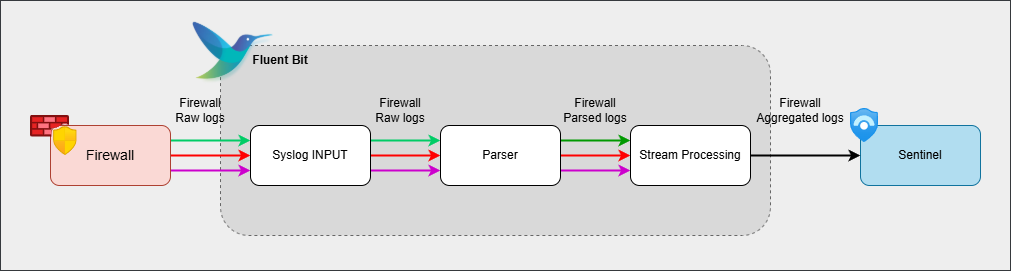 Initial Fluent Bit pipeline
The potential savings from this method will vary by environment, but I ran tests comparing sending all logs directly to Sentinel versus only aggregated data. I used historical real-world data ( and not my test logs).
| Without Aggregation | 15-Min Window | 30-Min Window | 60-Min Window | |
|---|---|---|---|---|
| Nr. of events | 100 million | 15 million | 12 million | 10 million |
| % of events | 100% | 15% | 12% | 10% |
| Size of data [GB] | 59 GB | 0.6 GB | 0.56 GB | 0.47 GB |
| % of size | 100% | 1.01% | 0.95% | 0.8% |
On my test data, using aggregated logging with a 15-minute tumbling window reduced the log count from 100 million to 15 million, and cut the total ingestion size from 59 GB down to 0.6 GB resulting in a 99% reduction. Increasing the window size can further decrease both the number of events and the overall data volume.
The test was conducted using data collected over a three-hour period. Using 15-minute tumbling windows (12 total bins), each bin processed ~5GB of raw data, which aggregated to ~50MB per bin - well under the 100MB Summary rule limit. However, the 1.25 million events per bin far exceeded the 500k-event cap that would have caused a similar Summary rule to fail.
You can further experiment with this setup by modifying the aggregation function, incorporating additional fields, or adjusting the time window for aggregation. Keep in mind that, depending on your configuration, you may need to allocate sufficient memory resources for your machine since stream processing operates on in-memory data.